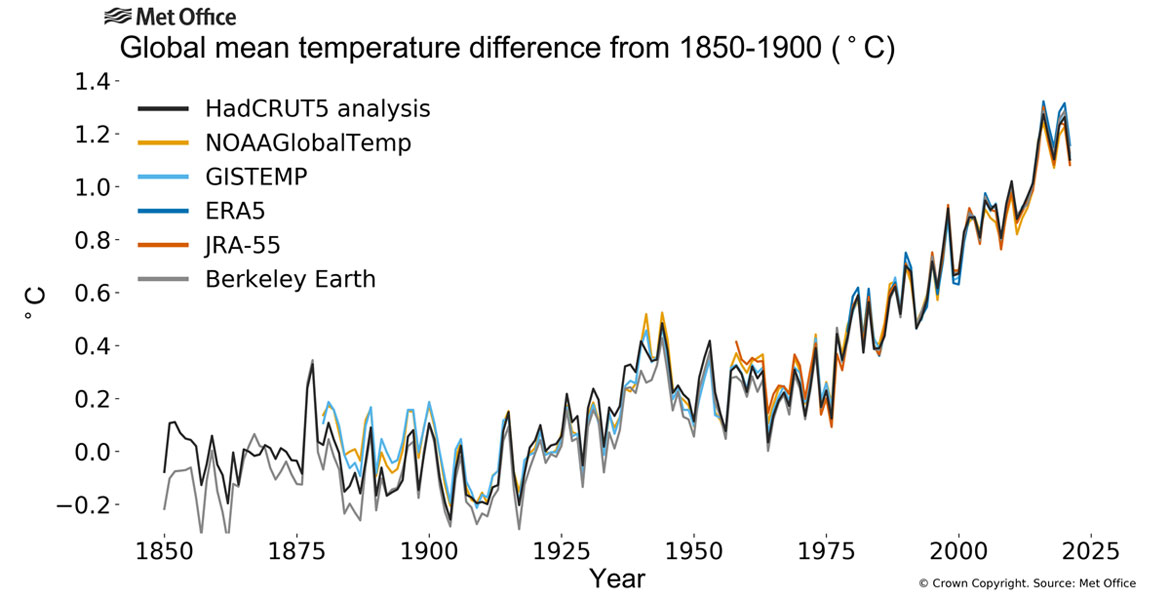
Although average global temperatures were temporarily cooled by the 2020-2022 La Niña events, 2021 was still one of the seven warmest years on record, according to six leading international datasets consolidated by the World Meteorological Organization (WMO).
Global warming and other long-term climate change trends are expected to continue as a result of record levels of heat-trapping greenhouse gases in the atmosphere, the agency said.
The average global temperature in 2021 was about 1.11 (± 0.13) °C above the pre-industrial era levels. The Paris Agreement calls for all countries to strive towards a limit of 1.5°C of global warming through concerted climate action and realistic Nationally Determined Contributions – the individual country plans that need to become a reality to slow down the rate of heating.
WMO said that it uses six international datasets “to ensure the most comprehensive, authoritative temperature assessment”, and the same data are used in its authoritative annual State of the Climate reports.
Since the 1980s, each decade has been warmer than the previous one, said WMO and “this is expected to continue.”
The warmest seven years have all been since 2015; the top three being 2016, 2019 and 2020. An exceptionally strong El Niño event occurred in 2016, which contributed to record global average warming.
“Back-to-back La Niña events mean that 2021 warming was relatively less pronounced compared to recent years. Even so, 2021 was still warmer than previous years influenced by La Niña”, said WMO Secretary-General, Prof. Petteri Taalas.
Undeniable trend
“The overall long-term warming as a result of greenhouse gas increases, is now far larger than the year-to-year variability in global average temperatures caused by naturally occurring climate drivers”.
“The year 2021 will be remembered for a record-shattering temperature of nearly 50°C in Canada, comparable to the values reported in the hot Saharan Desert of Algeria, exceptional rainfall, and deadly flooding in Asia and Europe as well as drought in parts of Africa and South America”, the WMO chief added.
“Climate change impacts and weather-related hazards had life-changing and devastating impacts on communities on every single continent”, Mr. Taalas underscored.
Others key indicators of global heating include greenhouse gas concentrations, ocean heat content, ocean pH levels (levels of acidity), global mean sea level, glacial mass and the extent of sea ice.
WMO uses datasets – which are based on monthly climatological data from observing sites and ships and buoys in global marine networks – developed and maintained by the US National Oceanic and Atmospheric Administration (NOAA), NASA’s Goddard Institute for Space Studies (NASA GISS), the United Kingdom’s Met Office Hadley Centre, and the University of East Anglia’s Climatic Research Unit (HadCRUT); and the Berkeley Earth group.
WMO also uses reanalysis datasets from the European Centre for Medium Range Weather Forecasts and its Copernicus Climate Change Service, and the Japan Meteorological Agency (JMA).
WMO said that the temperature figures will be incorporated into its final report on the State of the Climate in 2021, which will be issued in April this year.
This will reference all key climate indicators and selected climate impacts, and updates a provisional report issued in October 2021 ahead of the COP26 climate conference in Glasgow, Scotland.


